I created a Desmos(tm) art of my display pic
- Ronak Agrawal
- Aug 25, 2024
- 3 min read

Updated: Nov 16, 2024

[August 25, 2024]
No, the icon is not the art, nor does this look like me! I mean, it's art, just not the desmos(tm) one that I am talking about currently.
Quick context
I have been a Deadpool fan for over a decade (long before Ryan Reynolds got the character to mainstream - well, thank you, Ryan.) Being an IT professional, the most creative way I would express loyalty to my favorite character is by using one specific Deadpool art as my display pic in all my official accounts(including but not limited to Jira(tm), Slack(tm), etc.) and profiles across 5 different organisations.
Now, let me give you a sneak peek of the art that I have been using for over a decade as my display picture.

Yep, that's the one. By the way, I had to deal with a couple of delivery managers who suggested that this was not the most "professional" display pic when you are dealing with clients, but I managed 😉.
Bonus points for guessing why the guy in the pic is shooting himself.
So yes, I recreated this using desmos (a graphing calculator). I have been trained as an engineer, so my love of equations is not newfound.
At this point, if you are disappointed that you will not get to see an actual face using desmos art, 🤷
The Art
Here's a quick view (I won't make anyone click more than what they would necessarily need)
You can find the desmos art here
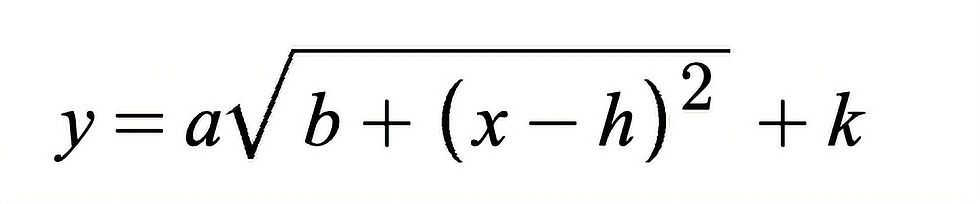
Foundational Equation
How surprised would you be if I told you I was able to create this in entirety using the quadratic equation?
Well, its an extension of the usual quadratic formula, and I have noted it below.
Following gif tries to give you an feel for how different variables impact the curve!

The inverted form gives a horizontal curve

If you want to know how to arrive from the simple looking equations to the actual pic, following view might be a teaser(btw, it was a painful but totally worth it!)
Look at the following snapshot. Guess what part of the art are we creating?

Had a good look?
<drumroll>The answer is the Thumb! All that to draw a THUMB!
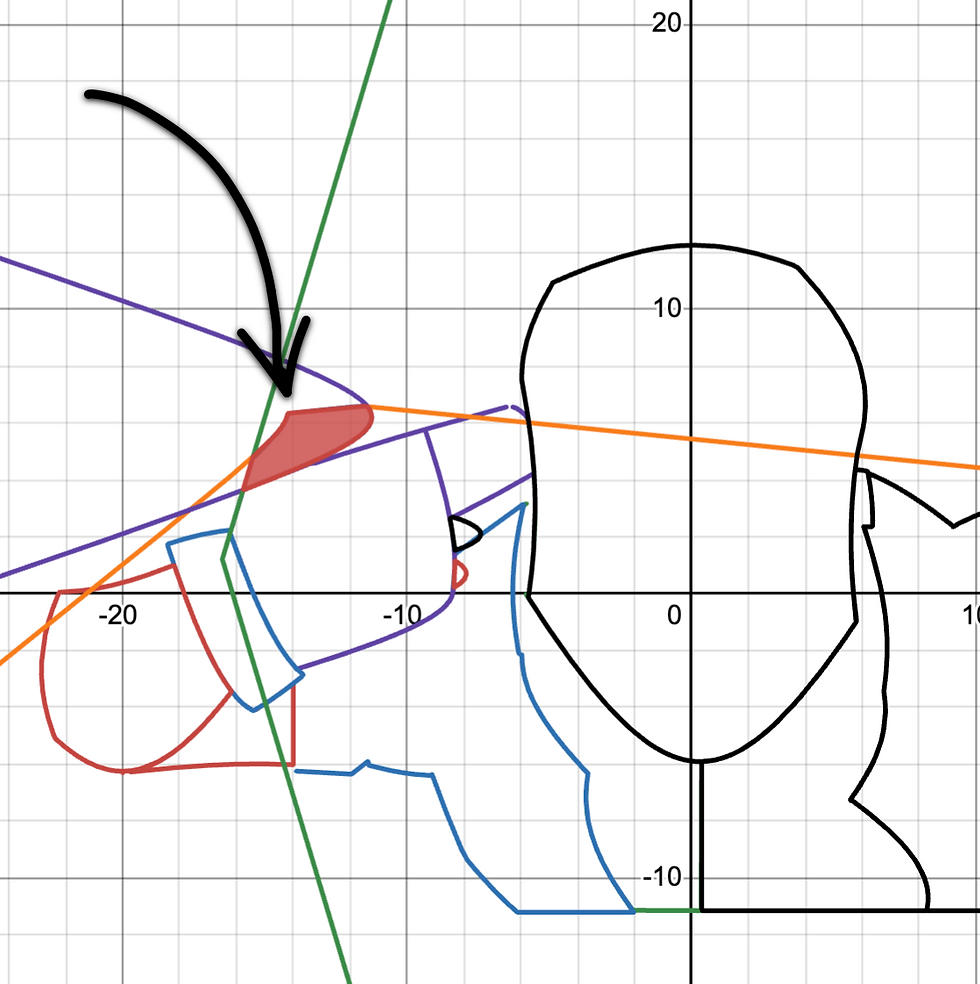
Aboth the equations I noted.
First equation is a piecewise function to draw the top edge of the thumb
The following 2 equations capture the other 2 curves.
The 0-equality (`0=`) tries to combine all these 3 equations into a single area.
The final inequality is for coloring the thumb.
Yeah!
Half way thru I really started to think if there was an easier way to do this, but I was far too invested. But I did manage to pull it off by sticking to the fundamentals(read as my limited knowledge)
Finally, the entire art was created using over 200+ equations.
While creating this, I encountered some unknowns. A couple of the interesting challenges were
Figuring out how to combine multiple equations - some tricks involve
Using piecewise ranged functions
Inverting functions when combining these.
Realising that coloring was a different beast altogether!
One had to create mutually exclusive regions for the color to respect boundaries and have homogenous fill. So, I had to re-work quite a bit😐!
Deadpool color pallete is by default available with desmos colors. I had to execute some custom javascript to get the deadpool color palette rendered on desmos graphing calculator.
Overall, it occupied my evenings for about 2 weeks. Completing this felt exhilarating.
End
Honestly, I don't really know why I did what I did, but the entire exercise was really fun!
Until next time. Have a good one ahead.


Comments